for Internsity Guided Depth Upsampling
People/contact
WE propose a novel depth upsampling method by residual interpolation (RI) that uses both a low-resolution depth map and a high-resolution intensity image. Our method is an application of the RI to depth upsampling, where the upsampling is performed in a residual domain following its success in the field of image demosaicking. Experimental results demonstrate that our method preserves the sharpness of depth discontinuities and outperforms existing well-known methods such as guided filtering.
Yosuke Konno, Yusuke Monno, Daisuke Kiku, Masayuki Tanaka and Masatoshi Okutomi
JSME/RMD International Conference on Advanced Mechatronics (ICAM), pp.1-2, 2015
The pdf file of summary paper and MATLAB ® code of the proposed method are available for download below.
This code is available only for research purpose.
Daisuke Kiku, Yusuke Monno, Masayuki Tanaka and Masatoshi Okutomi
IEEE International Conference on Image Processing (ICIP), pp-2304-2308, 2013
Daisuke Kiku, Yusuke Monno, Masayuki Tanaka and Masatoshi Okutomi
IS&T/SPIE Electronic Imaging (EI), Digital Photography X, Vol.9023, pp.90230L-1-8, 2014
Daisuke Kiku, Yusuke Monno, Masayuki Tanaka and Masatoshi Okutomi
IEEE Transactions on Image Processing, vol.25, no.3, pp.1288-1300, 2016
Yusuke Monno, Daisuke Kiku, Masayuki Tanaka and Masatoshi Okutomi
IEEE International Conference on Image Processing (ICIP), pp.3861-3865, 2015
Yusuke Monno, Daisuke Kiku, Sunao Kikuchi, Masayuki Tanaka and Masatoshi Okutomi
IEEE International Conference on Image Processing (ICIP), pp-645-649, 2014
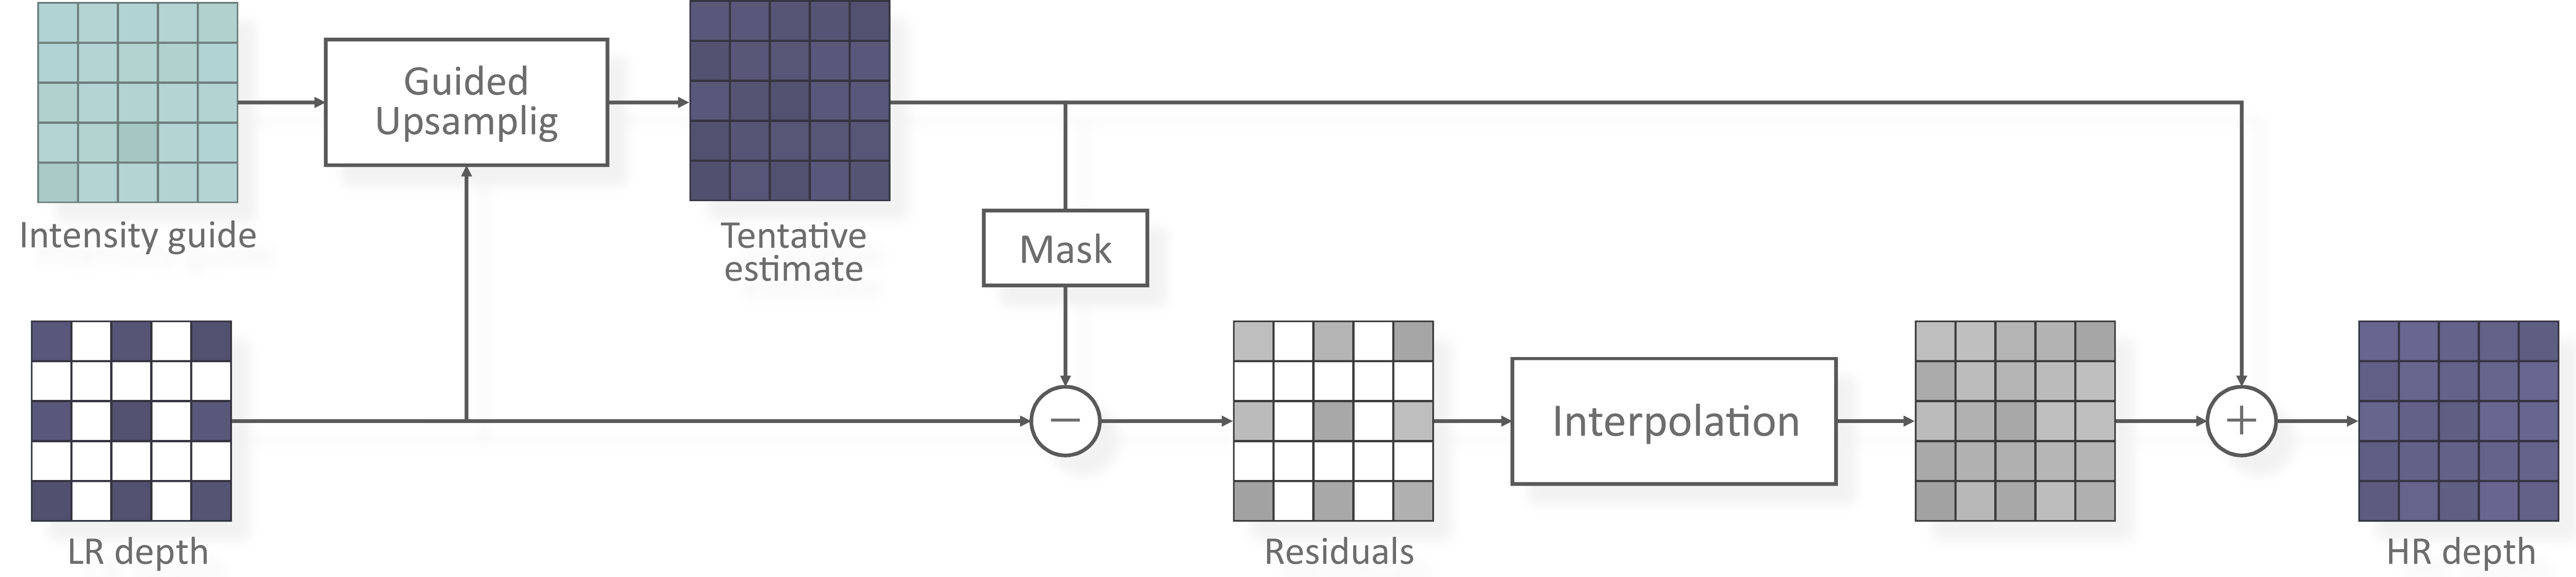
Fig. 1 The overall processing pipeline of Residual Interpolation.
This method is motivated from the fact that the residual map becomes flatly smooth when there is a correlation between the intensity guide image and the depth map, and that the smooth condition of the residual map generally improves the performance of the interpolation. Therefore, It performs upsampling operation again on the residual domain, after the tentative upsampling.


LR input depth map
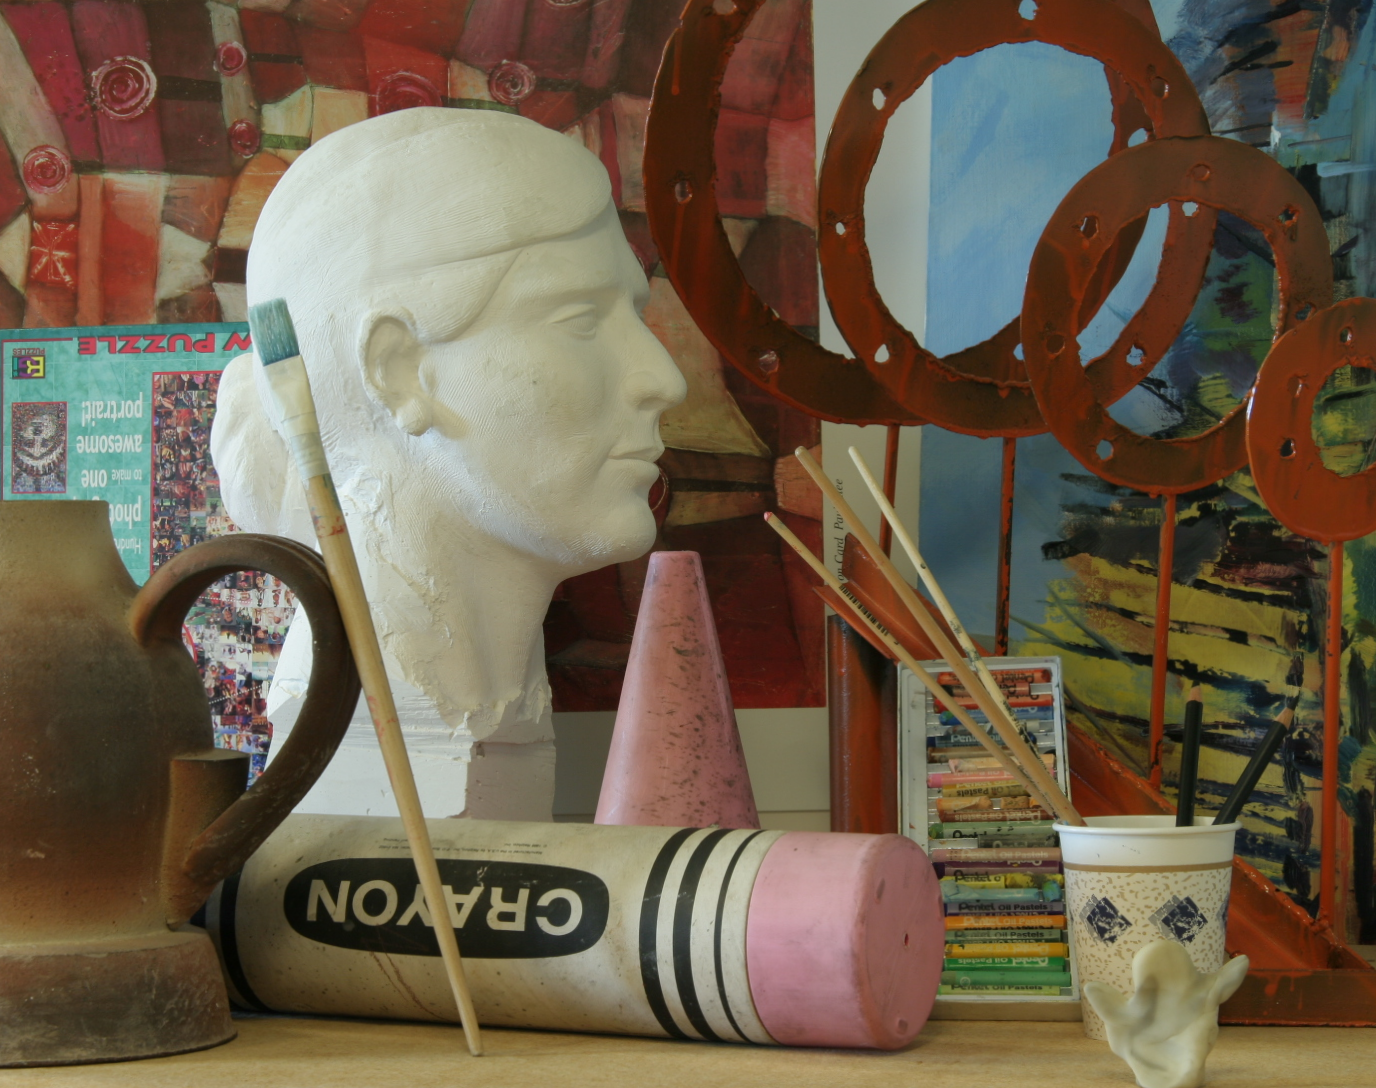
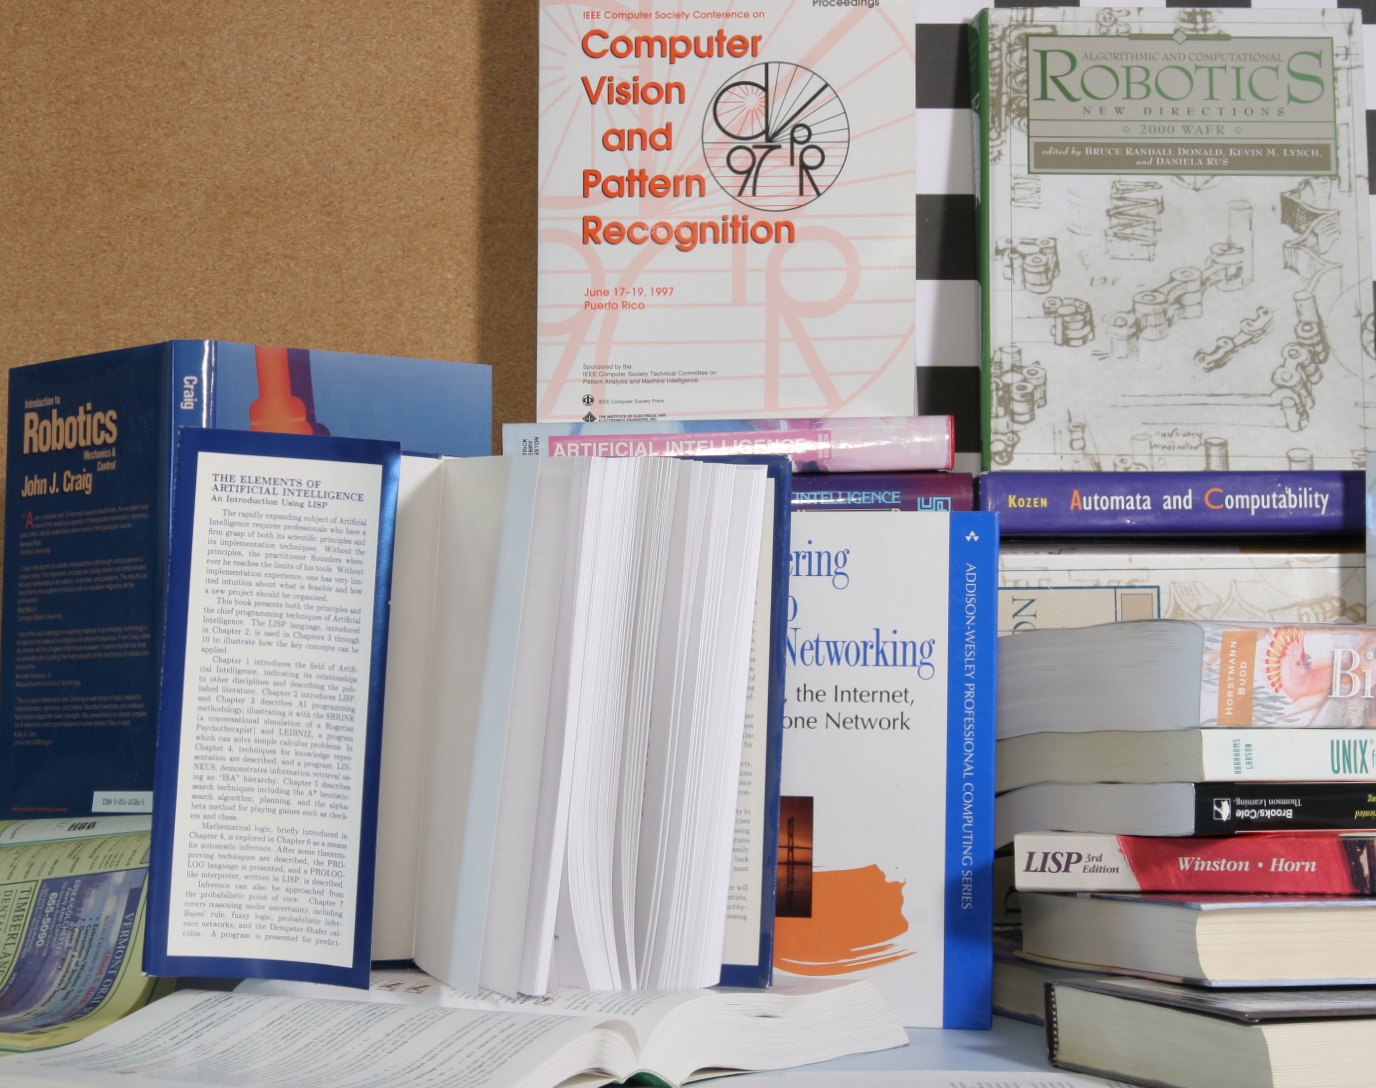
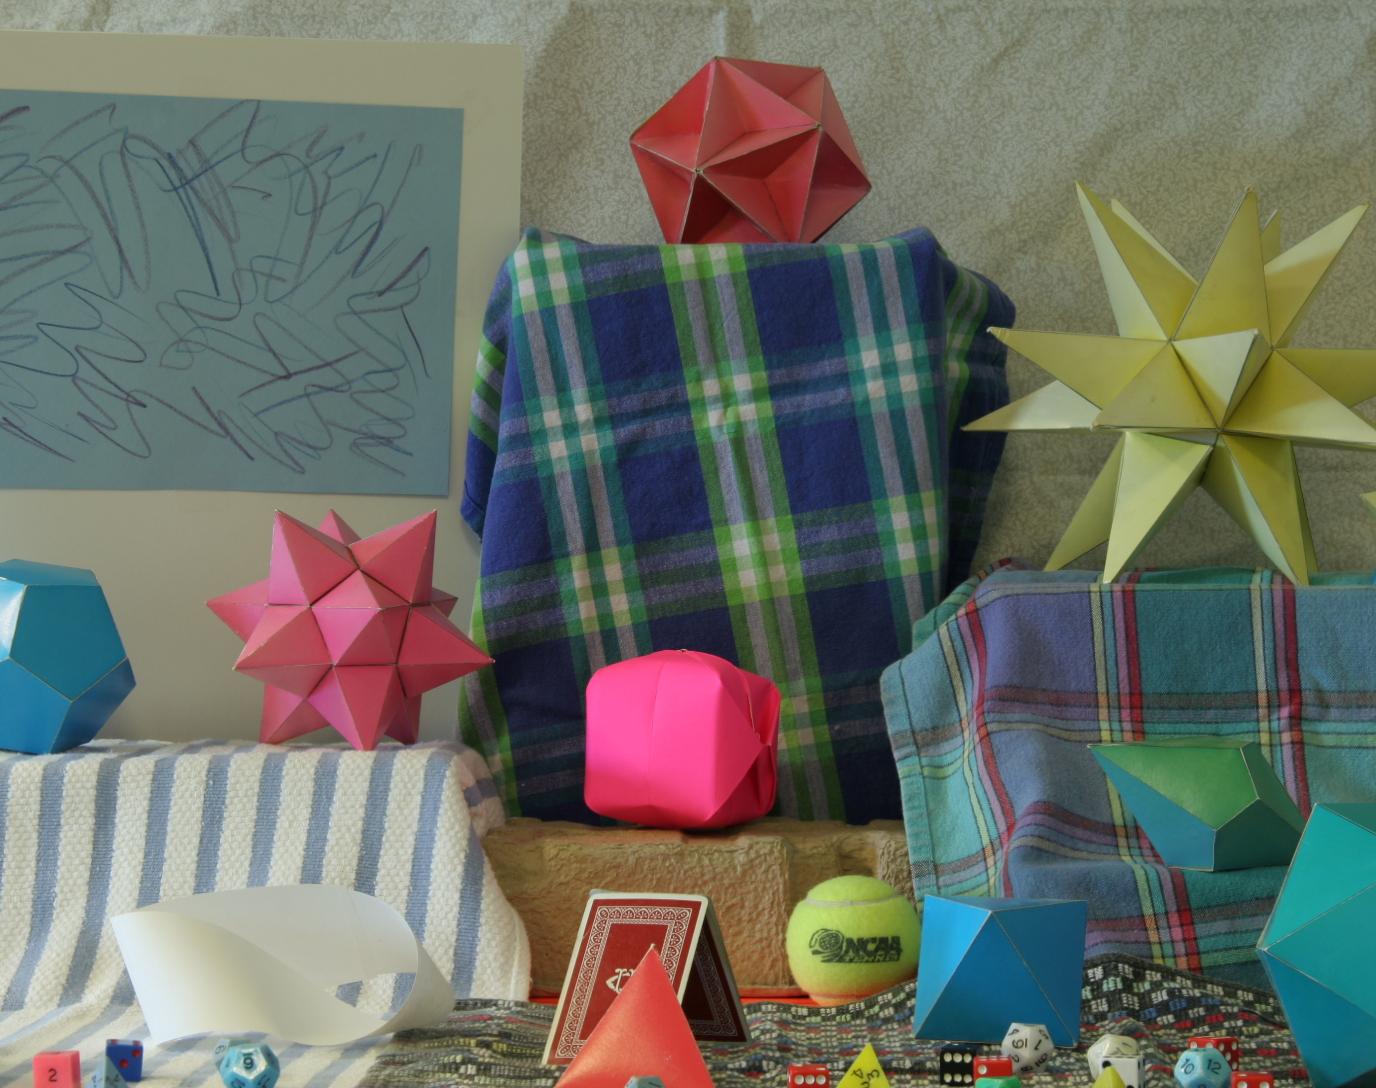
HR intensity guide image


Upsampling result


Ground truth
Fig. 2 The visual comparison of x8 upsampling on the Middlebury dataset [3]
| Art | Books | Moebius | Average | |||||||||||||
| x2 | x4 | x8 | x16 | x2 | x4 | x8 | x16 | x2 | x4 | x8 | x16 | x2 | x4 | x8 | x16 | |
|---|---|---|---|---|---|---|---|---|---|---|---|---|---|---|---|---|
| Bicubic | 3.17 | 4.09 | 5.69 | 8.42 | 1.29 | 1.67 | 2.37 | 3.20 | 1.18 | 1.50 | 2.06 | 3.04 | 1.88 | 2.42 | 3.37 | 4.89 |
| JBU [1] | 3.19 | 4.16 | 5.73 | 8.38 | 1.30 | 1.74 | 2.39 | 3.29 | 1.25 | 1.66 | 2.27 | 3.28 | 1.91 | 2.52 | 3.46 | 4.98 |
| GF [2] | 3.45 | 4.75 | 6.91 | 9.89 | 1.44 | 2.02 | 2.86 | 4.13 | 1.41 | 1.97 | 2.80 | 4.14 | 2.10 | 2.91 | 4.19 | 6.05 |
| Proposed | 2.98 | 3.50 | 4.75 | 7.03 | 1.24 | 1.45 | 1.94 | 2.77 | 1.15 | 1.38 | 1.87 | 2.80 | 1.79 | 2.11 | 2.85 | 4.20 |
Table 1 Qualitative Middlebury evaluation measured as Root Mean Squared Error (RMSE).
     |
Copyright 2015 Tokyo Institute of Technology. All rights reserved.